HDTune is a highly popular and user-friendly hard disk diagnostic tool. While there are many hard disk testing tools available on the market—such as the commonly used PartitionMagic and HDDlife Pro—HDTune stands out. It is extremely lightweight, only a few megabytes in size, yet offers comprehensive functionality. It includes all the standard features found in similar software, such as hard disk transfer rate testing, health status monitoring, temperature detection, and surface scanning. Despite its small size, it is fully-featured—a rare and valuable combination. Moreover, HDTune provides additional advanced disk testing capabilities such as AAM (Automatic Acoustic Management) control, disk erase/writing, file benchmarking, and random access tests, giving users a more complete picture of their hard drive's condition and making the health status of your disk clearly visible at a glance.
HD Tune Hard Disk Diagnostic Tool Features
1. The program is not packed with an encryption shell (as encryption shells can severely impact compatibility, stability, and speed). Instead, only a simple compression shell is used to reduce the program size, making it highly portable!
2. Perfectly displays Celsius and Fahrenheit symbols in Chinese (including in the system tray).
3. Completely resolves the issue of garbled default filenames when saving screenshot files.
4. The main program interface contains no logos or promotional images for bundled software.
Detailed Knowledge
1. Why do read speed test results vary so much?
Read speed test results are easily affected by the current system state, which causes confusion for many users who see inconsistent results. This concern is unnecessary. Nowadays, many laptops come pre-installed with Windows 7, and manufacturers often add their own software to enhance product appeal. Differences in whether these third-party programs are enabled or disabled can significantly affect test outcomes. If antivirus software is running, the test results will certainly be suboptimal. Therefore, you cannot directly judge a hard disk's quality based solely on simple read speed tests. There's also no need to compare or compete over read speeds.
2. What do the curve and yellow dots in the test results represent?
1. The light blue curve represents the disk's read speed per second during the test.
2. The yellow dots represent the disk's seek time.
3. The blue line should be stable—not fluctuating wildly.
4. The blue curve shows the read speed across the entire disk (from outer to inner tracks). Faster speeds and a smoother curve are better. If there are large dips (and you've ruled out interference from antivirus software or other running programs), it may indicate a problem with the disk.
5. The yellow dots indicate "access time" (seek time + rotational latency)—the shorter, the better.
3. Understanding transfer speed values
The test displays minimum, maximum, and average transfer speeds, as well as access time, burst data transfer rate, and CPU usage. One additional note: In the "Benchmark" test, changing the "block size" option can significantly affect the accuracy of test data. Therefore, don't blindly trust hard disk benchmark results from certain websites, as results can vary widely depending on settings.
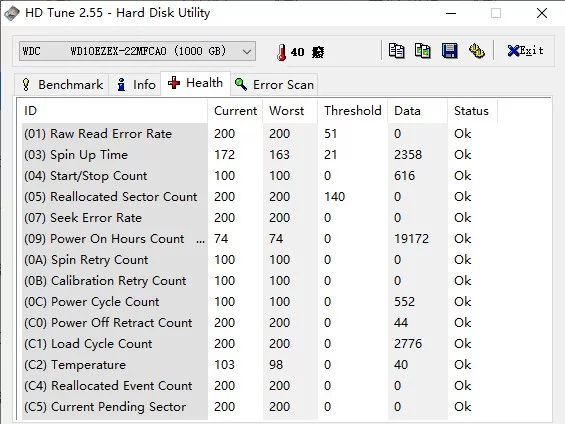
4. S.M.A.R.T. Attributes Table
S.M.A.R.T. (Self-Monitoring, Analysis, and Reporting Technology) includes many attributes, each with only two possible states: above or below threshold. If any attribute exceeds its threshold, it indicates the "hard drive is nearing failure." Each drive's S.M.A.R.T. data includes defined thresholds, which vary by manufacturer. The relationship between attribute values and thresholds can be of two types: "should be greater than threshold" or "should be less than threshold."
A. 01 = Read Error Rate / (Low-level) Data Read Error Rate
Refers to the rate of hardware read errors when reading data from the disk surface. The raw (Raw) value follows different schemes for different manufacturers, so viewing it simply as a decimal number is meaningless.
* This translation is based on the Wiki English version. There appears to be some debate about this attribute—some say higher is better, others say lower. We follow the Wiki interpretation here. As long as the "Worst" value is not less than the "Threshold," it's acceptable.
** The Raw value may vary—e.g., a laptop ST drive might show 0, while a desktop 1.5TB ST drive shows 227901540.
B. 02 = Throughput Performance / Read-Write Throughput Performance
Higher Raw values are better. Indicates overall drive throughput performance. A continuously decreasing value strongly suggests potential disk problems.
* Usually only has a value after a manual Offline S.M.A.R.T. test.
C. 03 = Spin-Up Time / Motor Spin-Up to Standard Speed Time
Lower Raw values are better. Average time for spindle motor to accelerate from zero to full (standard) speed (in milliseconds). Units may also be seconds. A value of 0 usually indicates a read error or data generation fault—should not normally be 0.
D. 04 = Start/Stop Count / Start/Stop Cycles
Counts the number of times the motor starts or the disk fully stops (power off) and restarts, including recovery from sleep mode.
* Generally increases by 1 per power-on. Can be viewed as power-on count—a useful lifespan reference. Useful when purchasing a used drive.
E. 05 = Reallocated Sectors Count / Count of Reallocated Sectors
Lower Raw values are better. Counts sectors that have been reallocated. When the disk detects a read/write/verify error, it marks the sector as "reallocated" and moves the data to a reserved spare area (also called "remapping"). This is why modern hard drives show no "bad blocks" during surface scans—all bad sectors are hidden within reallocated ones. However, as more sectors are reallocated, read/write speeds tend to decrease. The Raw value typically represents the number of detected and remapped bad sectors. Therefore, a higher value means more sectors have been remapped—so lower is better.
* Ideally, this value should be 0. If not, don't panic immediately. Monitor its trend: if it remains stable over several weeks, you can likely continue using the drive for a long time. If it keeps rising, back up your data immediately and consider replacing the drive.
F. 06 = Read Channel Margin / Read Channel Boundary
Represents the margin of the read channel during data reading. The exact function of this attribute is not clearly defined.
How to Repair a Hard Drive Using HD Tune?
HD Tune only supports detection, not repair. Users can use built-in system tools for repair, which are generally effective. Repair requires a restart. Select both "Automatically fix file system errors" and "Scan for and attempt recovery of bad sectors," then click OK. Follow the on-screen prompt to restart. Specific repair steps:
1. Right-click the Start button and select 【Command Prompt (Admin)】
2. Use the disk repair tool: chkdsk. Enter chkdsk /? and press Enter to view options.
3. Enter chkdsk d: /F, where "d:" is the drive letter of the partition to repair. Replace "d:" with the appropriate drive letter based on your setup (case-insensitive). Press Enter to begin checking and repairing.
If Bad Sectors Are Detected
1. If HD Tune detects bad sectors, first check which partition they are on. For example, if it's on drive D:, back up all files from that partition, then format the partition (do not use quick format).
2. After formatting, scan again. If red dots still appear, it indicates physical bad sectors, not logical ones.
3. Physical bad sectors cannot be repaired but can be isolated.
4. The simplest method is to delete the affected partition and then re-partition the disk.
Write Function Disabled
Write testing cannot be performed if there are hard disk partitions. You must delete all partitions before performing a write test.